Graphical data
The Weather Manager Graphical data settings are used to display and manipulate weather data for the selected weather location in a graphical interface. The graphs display weather data for each hour of the selected design day. Weather data that is stored in the active project can be manipulated by interacting with the points on the graph.
Graphical data is interactive:
Curves can be queried by positioning the pointer over a curve. A small pop up dialog box displays the data for the nearest plotted point. Edit weather data by dragging plotted points along the Y axis. Changes made here are updated in the numerical data, and can be saved for the project to use in steady state and prescriptive calculations. Right click anywhere on the graph to activate the following pop-up menu. Use the menu to view the available weather data graphs.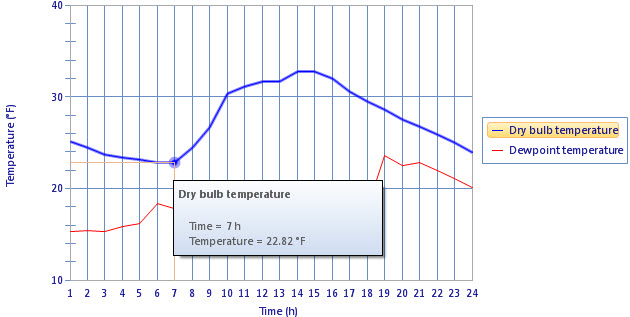
Panel settings
| Setting | Description |
|---|---|
| Month | Used to select a month of weather location data to display. |
| Day | Used to select a day in the selected month to display its weather data. |
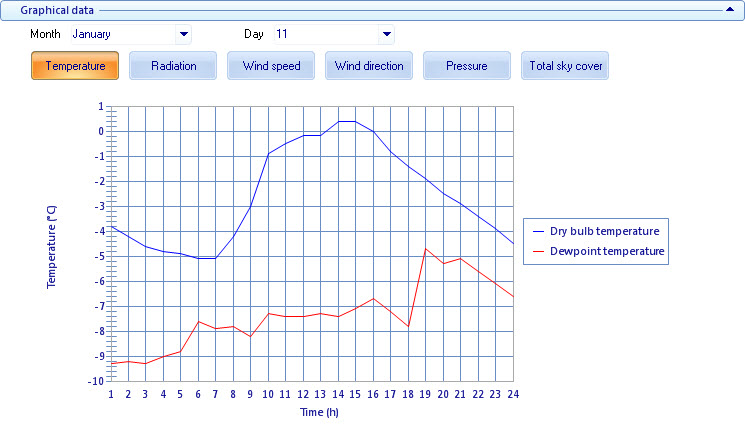
| Temperature | Click to graphically display the weather profile location design temperatures for the selected design day (illustrated above). The hourly data is plotted on Dry bulb and Dewpoint (wet bulb) temperature (Y axis) curves. |
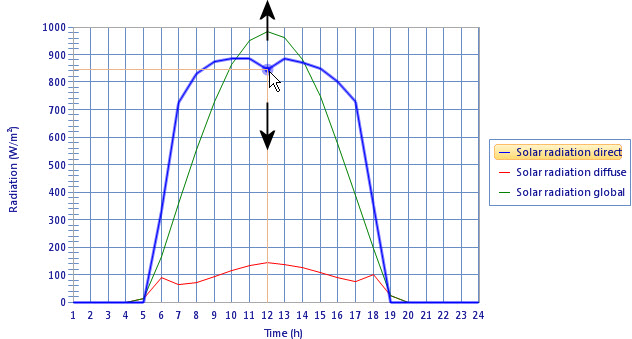
| Radiation | Click to graphically display the weather profile location solar gains for the selected design day. The hourly data is plotted on Solar radiation direct, Solar radiation diffuse and Solar radiation global gains curves. These three components when summed are the total solar gains measured for the location. |
| Wind speed | Click to graphically display the weather profile location wind speed for the selected design day. The hourly data is plotted on a Wind speed curve. |
| Wind direction | Click to graphically display the weather profile location wind direction for the selected design day. The hourly data is plotted on a Wind direction curve. Wind direction is displayed in degrees based on North being zero degrees. |
| Pressure | Click to graphically display the weather profile location atmospheric pressure for the selected design day. The hourly data is plotted on a Pressure curve. |
| Total sky cover | Click to graphically display the weather profile location total sky cover for the selected design day. The hourly data is plotted on a Cloud cover curve. |